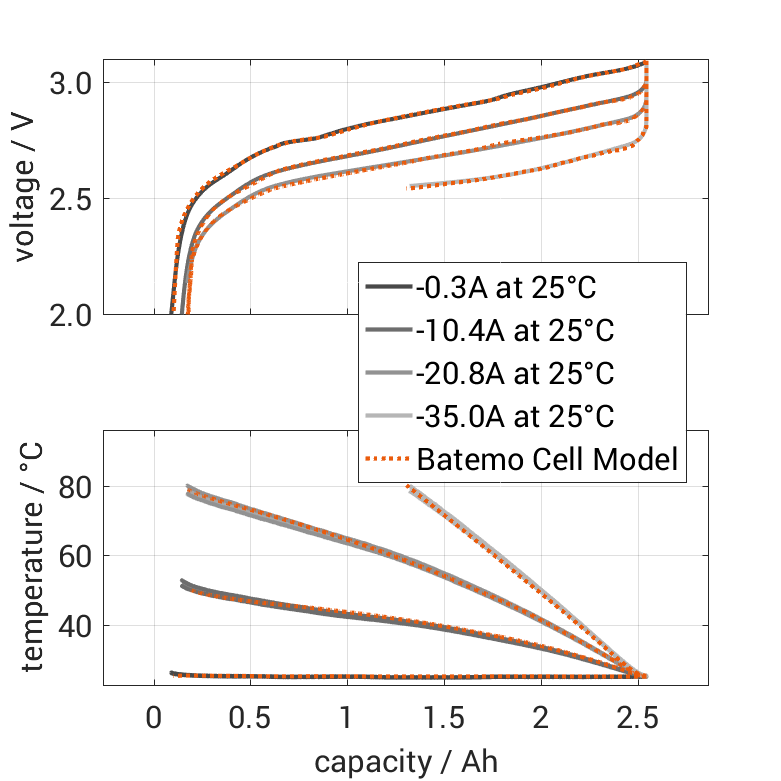
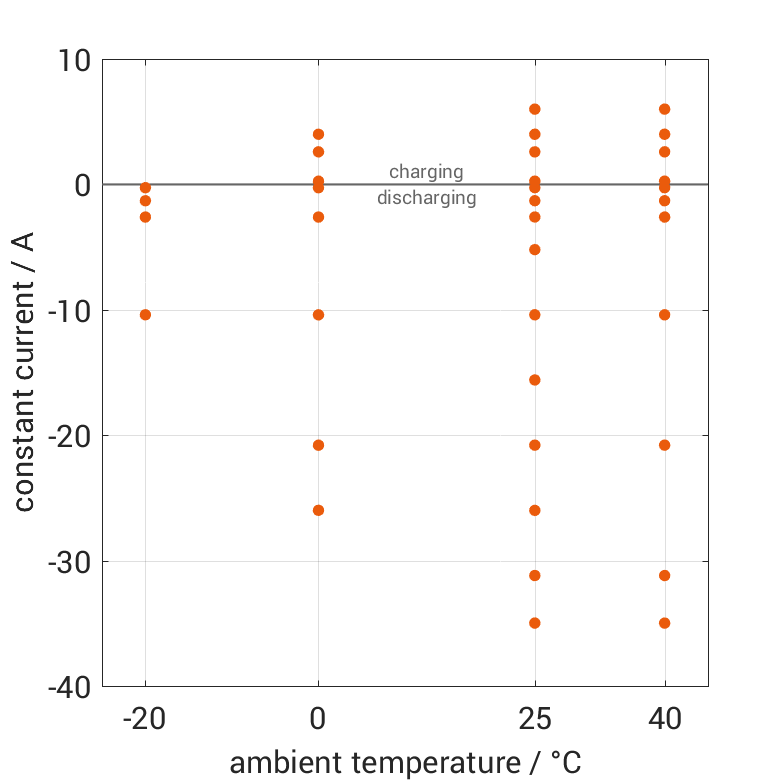
Discharge Characteristics
The cell is discharged from 100% SOC with different constant currents at different ambient temperatures. The thermal boundary condition is free convection. The measurement stops when reaching either the voltage of 2.0V or the surface temperature of 80°C.
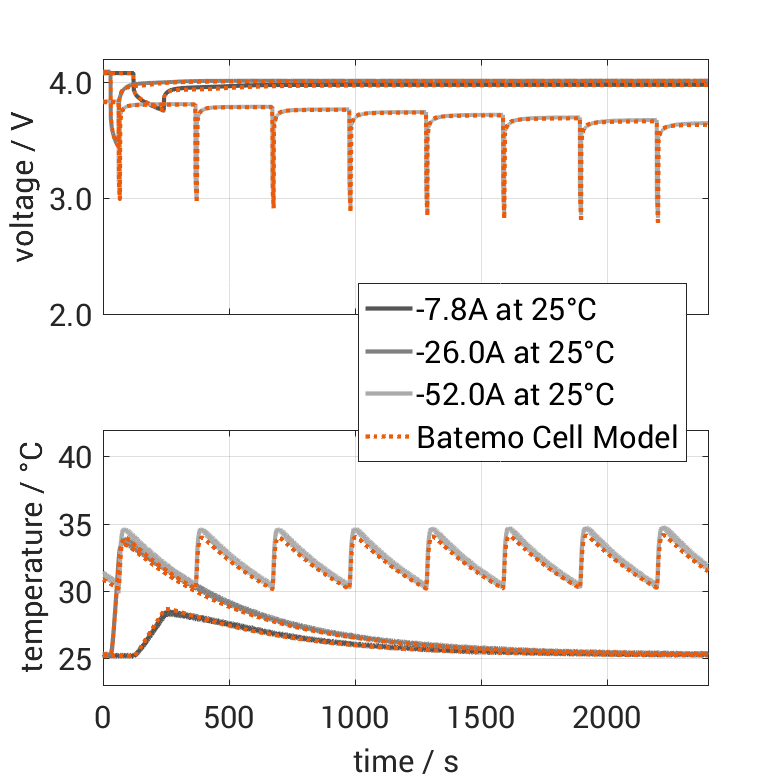
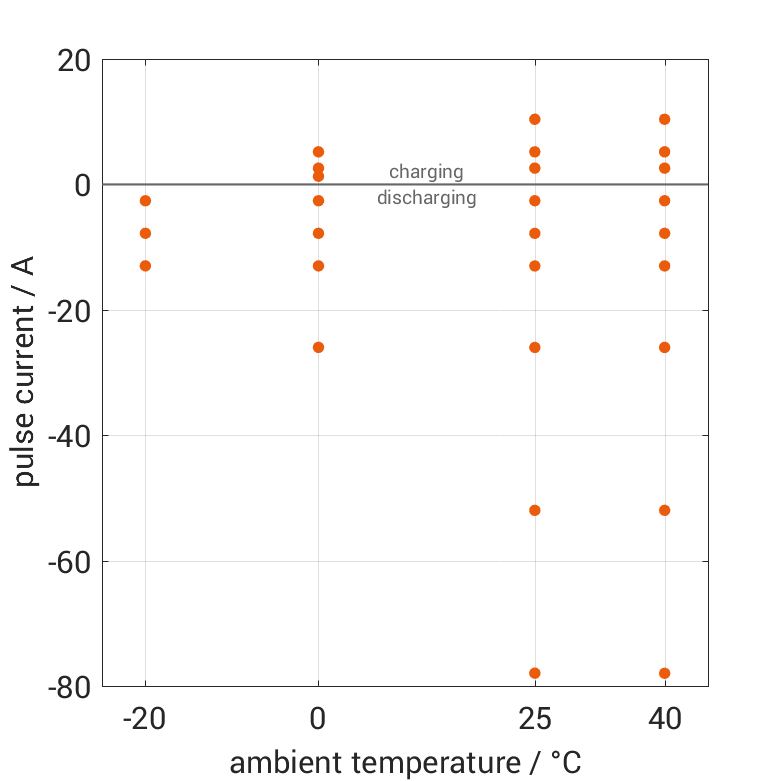
Pulse Characteristics
The cell is discharged from 100% SOC with current pulses followed by no-load phases at different ambient temperatures. The thermal boundary condition is free convection. The measurement stops when reaching either the voltage of 2.0V or the surface temperature of 80°C. The graph shows a zoomed view of the measurement to visualize one of the pulses.
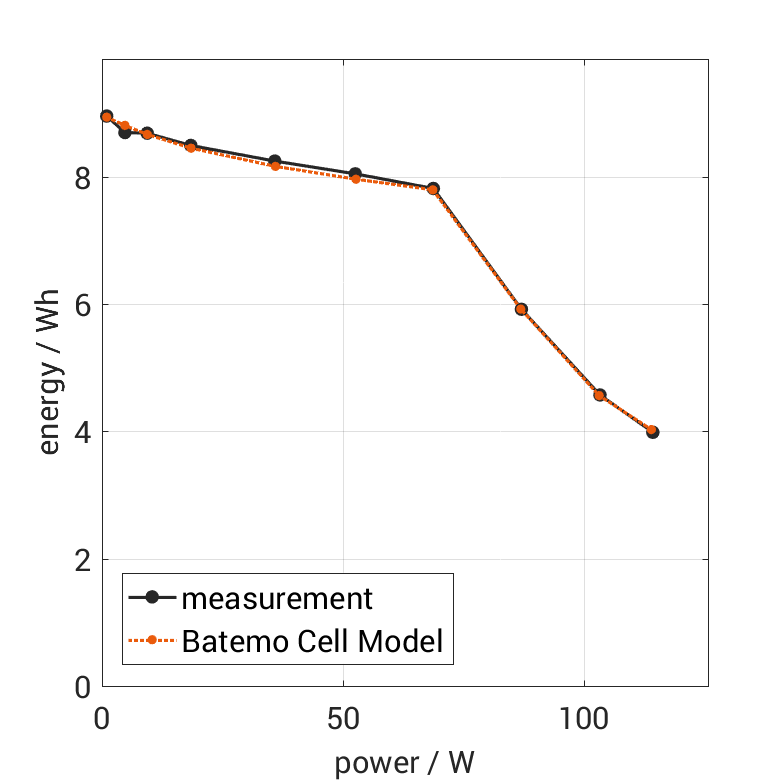
Energy Characteristics
The cell is discharged from 100% SOC with different constant currents at 25°C. The thermal boundary condition is free convection. The measurement stops when reaching either the voltage of 2.0V or the surface temperature of 80°C. The graph shows the derived exchanged energy and average power of the experiment.
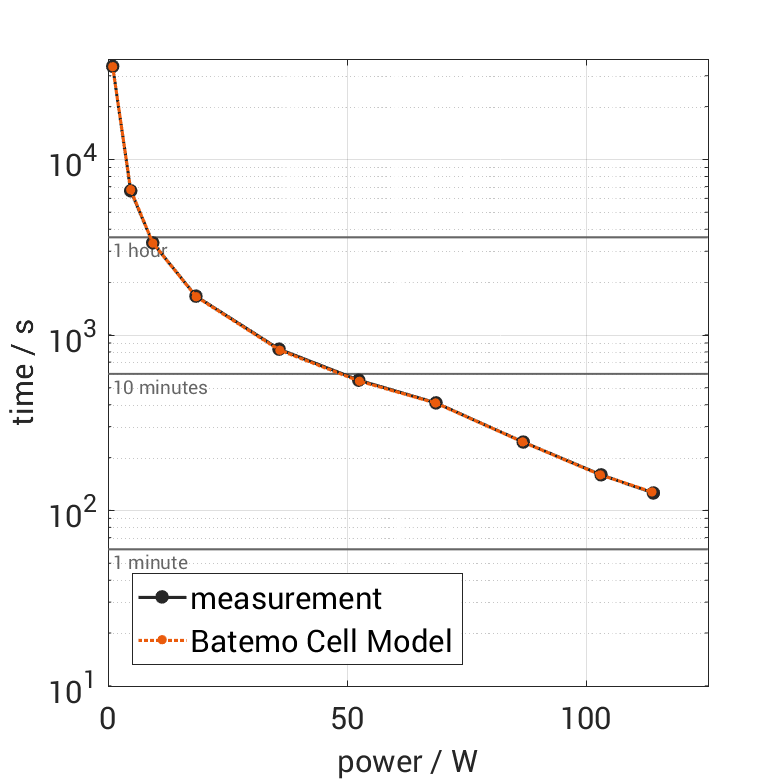
Power Characteristics
The cell is discharged from 100% SOC with different constant currents at 25°C. The thermal boundary condition is free convection. The measurement stops when reaching either the voltage of 2.0V or the surface temperature of 80°C. The graph shows the derived experiment duration and average power of the experiment.
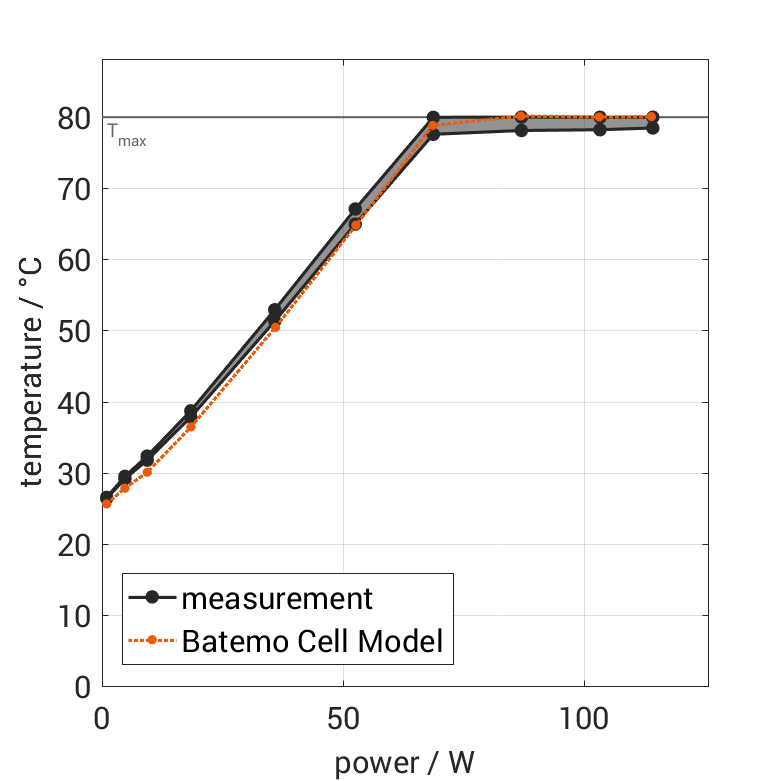
Thermal Characteristics
The cell is discharged from 100% SOC with different constant currents at 25°C. The thermal boundary condition is free convection. The measurement stops when reaching either the voltage of 2.0V or the surface temperature of 80°C. The graph shows the cell surface temperature at the end and the derived average power of the experiment.