Batemo Insights
Stop relying on datasheets.
Independently lab-measured performance data for 343 lithium-ion and sodium-ion cells — measured on our own test benches in Karlsruhe under identical conditions, which is what makes them comparable with each other.
Cells measured from Samsung SDI · LG Energy Solution · CATL · BYD · Panasonic · Molicel · EVE Energy
Request a demo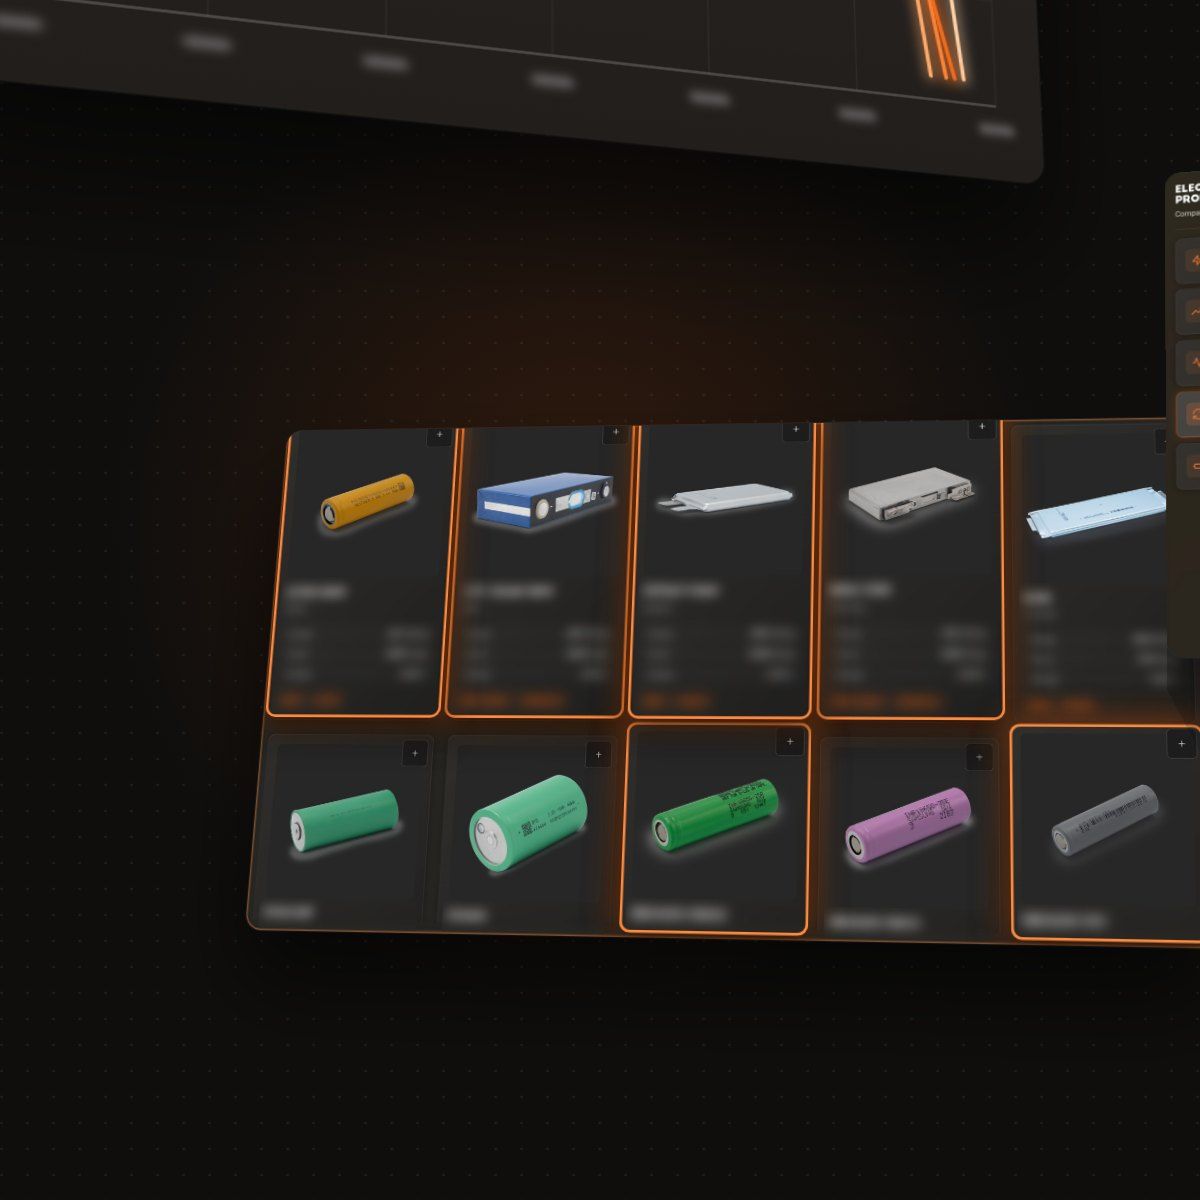
Built for every stage of cell evaluation.
Find the right cell — fast.
Narrow 343 lab-measured cells down to your shortlist. Filter by performance criteria, compare candidates side by side, and decide from measurements instead of reading datasheets.
Track where the technology is going.
Follow how cathode chemistry evolves, how the performance envelope shifts year by year, and how emerging sodium-ion cells compare against established LFP.
Compare cells and share the result.
Put cells side by side in Ragone plots and radar charts, then export them for your next design review — without characterizing anything in your own lab first.
Everything needed to evaluate a cell — in one place.
The public Cell Explorer shows what a cell does. Insights shows why: what is inside it, how it behaves at its limits, and how it compares to everything else measured the same way.
- Selection
- Filter by format (18650, 21700, 46XXX, 26XXX, pouch, prismatic), by manufacturer, by capacity and energy density — and by cathode and anode chemistry (NMC, NCA, LFP, graphite, silicon).
- Comparison
- Interactive Ragone plots, radar charts and direct side-by-side views. Energy density in Wh/kg, power density in W/kg, thermal behavior.
- Full characterization
- Electrochemical impedance spectroscopy, heat generation and thermal properties, internal resistance, discharge curves at several C-rates, usable energy at several temperatures, capacity loss after formation.
- Prepared questions
- Analytical questions across cell performance, cathode chemistry, technology evolution and supplier positioning — each with expert-level charts instead of a raw table.
One cell, in full. muRata US18650-VTC4.
Everything below is measured, on one 18650 cell that anyone can look up in the public Cell Explorer. There it has 2.128 Ah and a voltage range. Here it has 5 discharge curves, 35 operating points, a batch of 4 cells measured individually, and a chemistry.
Batemo Insights
Discharge, five currents
From 0.1 C to 12 C at 25 °C ambient. The public library gives you one capacity number for this cell. These curves show how much of it you actually get, and at which voltage.
voltage / V
capacity / Ah
- 0.21 A
- 2.13 A
- 8.51 A
- 17.02 A
- 25.53 A
Batemo Insights
Surface temperature during the same discharge
The same five runs, measured at the cell surface. At 12 C the cell gives up capacity and gains heat at the same time — one curve without the other is half the answer.
surface temperature / °C
capacity / Ah
- 0.21 A
- 2.13 A
- 8.51 A
- 17.02 A
- 25.53 A
Batemo Insights
Usable energy against power
usable energy / Wh
discharge power / W
Batemo Insights
Surface temperature against power
max. surface temperature / °C
discharge power / W
Only in Batemo Insights
Impedance spectrum at 25 °C
42 frequencies, from 0.01 Hz to 1.3 kHz. The arc is what the cell does inside: the left crossing is the pure ohmic part, the arc is the charge transfer at the electrodes, the tail on the right is diffusion. No datasheet carries this.
Only in Batemo Insights
Spread within one batch
The number a pack designer needs and a datasheet never carries.
CapacityAh
Internal resistancemΩ
- ± 0.12 %spread in capacity, 4 cells, mean 2.0749 Ah
- ± 2.22 %spread in internal resistance, 4 cells, mean 18.44 mΩ
Only in Batemo Insights
Chemistry and initial aging
- Main chemistry
- NMC
- Cathode
- NMC532
- Anode
- graphite
- Housing
- steel
- Capacity loss after formation
- 0.08 % over 15 equivalent full cycles
- Impedance increase over the same cycles
- + 2.25 %
- Heat generated at peak discharge
- 11.04 W, surface reaching 79.4 °C
Chemistry is the one field the public Cell Explorer never shows — for any of the 343 cells. It is shown here, for this one sample cell, so that you can see what the locked filter would give you.
This exists for all 343 cells in the library, in 7 sections each. Bring the cells you are considering and we will open them side by side.
Ask for these numbers on your cellsTechnology Radar
Three prepared analyses in Insights, each with expert-level charts instead of a raw table.
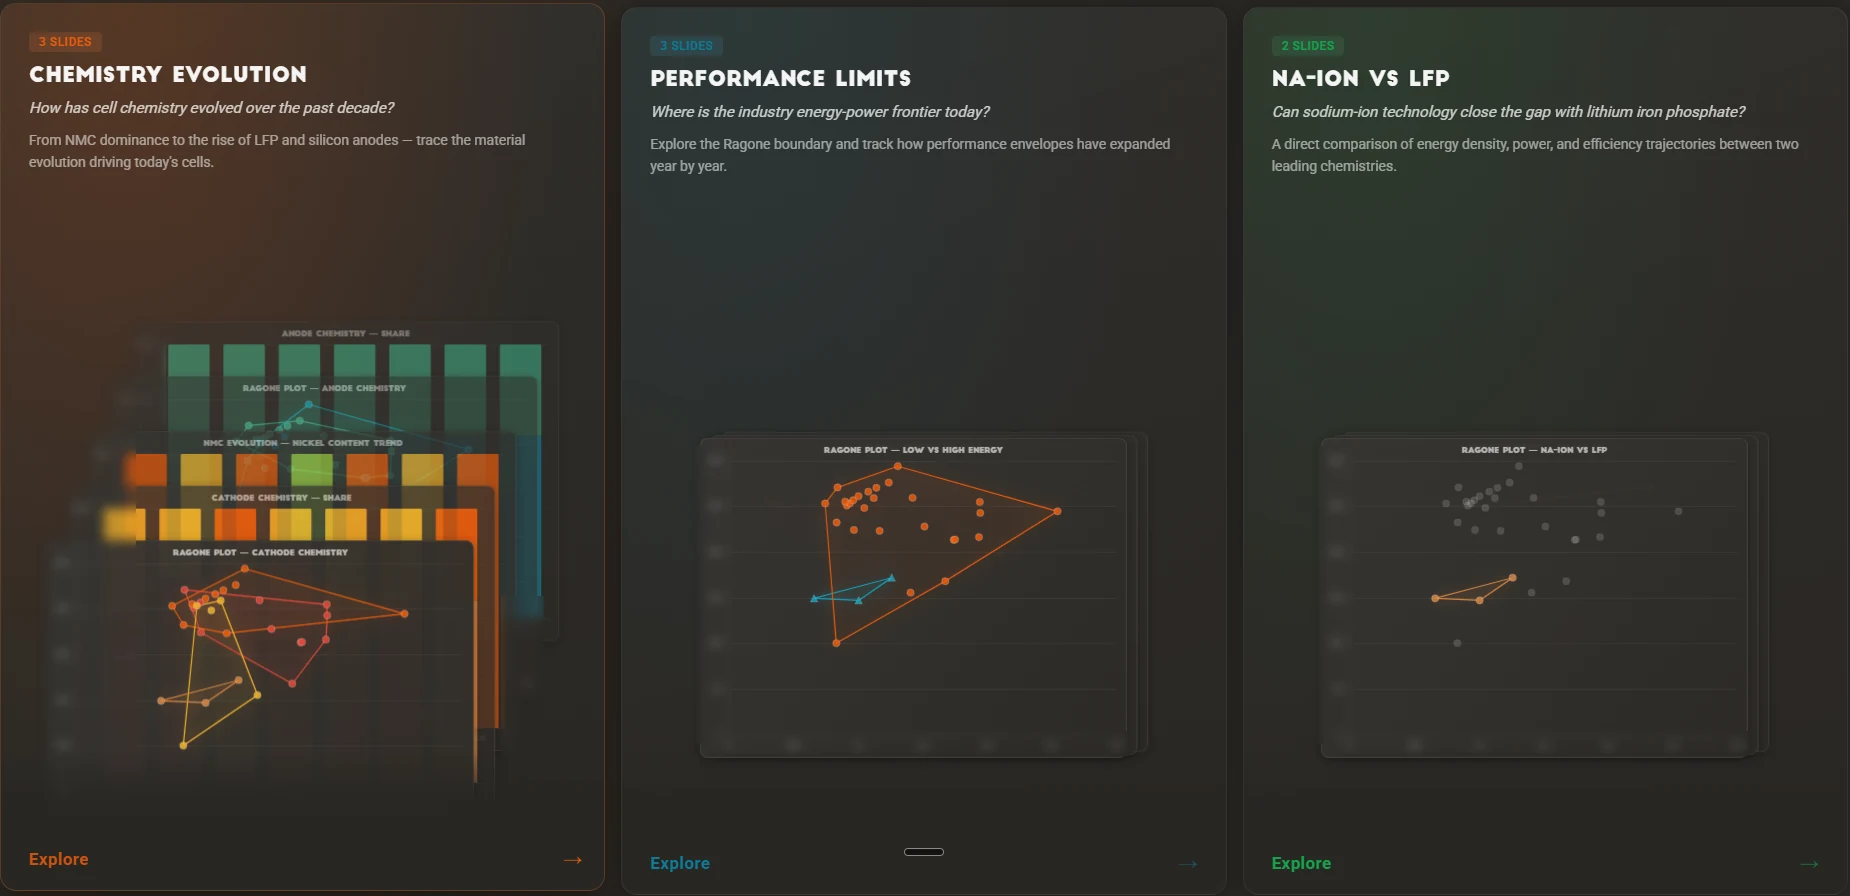
Chemistry Evolution
How has cell chemistry evolved over the past decade?
From NMC dominance to the rise of LFP and silicon anodes — trace the material evolution driving today's cells.
Performance Limits
Where is the industry energy-power frontier today?
Explore the Ragone boundary and track how performance envelopes have expanded year by year.
Na-ion vs LFP
Can sodium-ion technology close the gap with lithium iron phosphate?
A direct comparison of energy density, power, and efficiency trajectories between two leading chemistries.
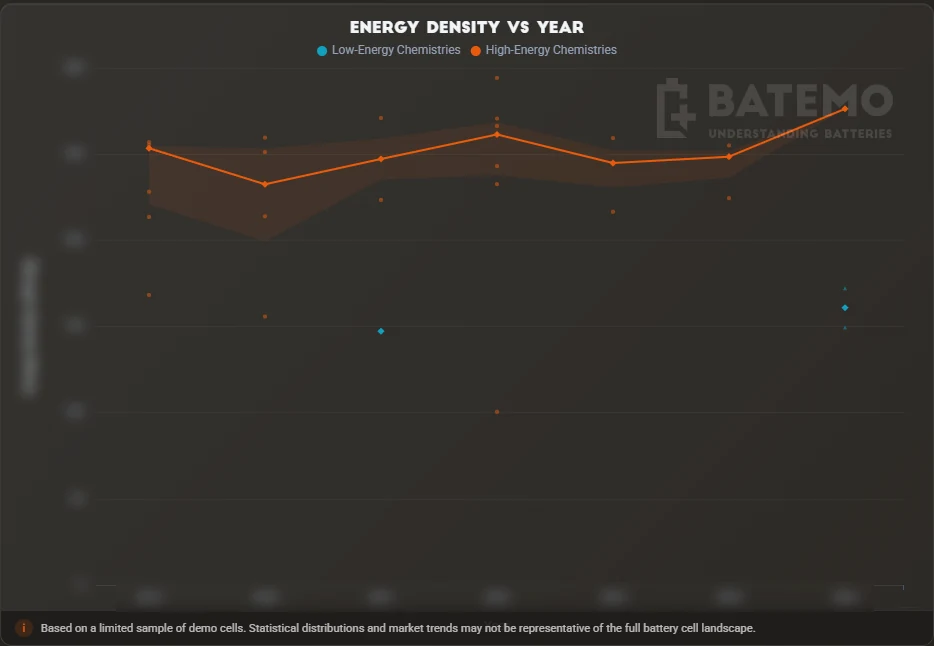
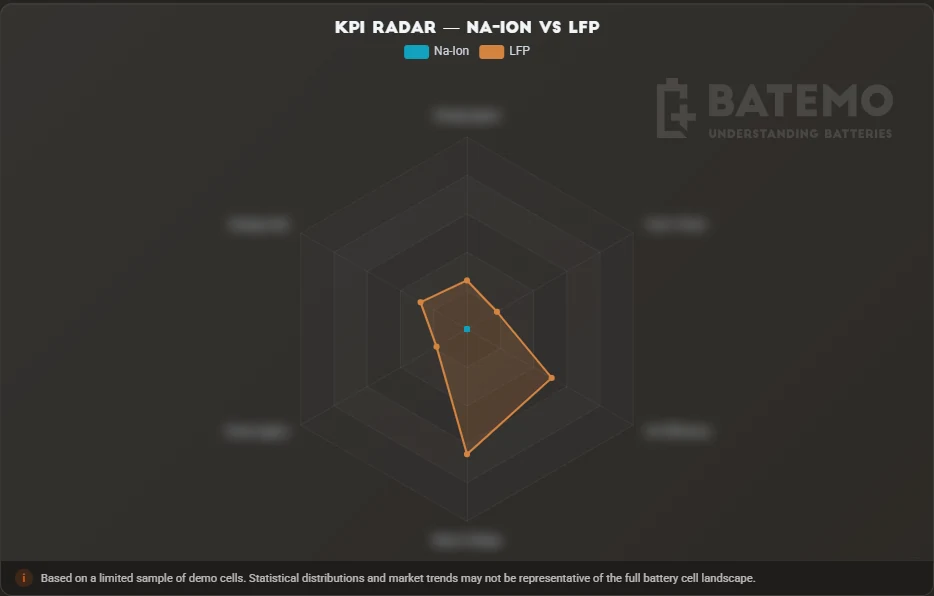
Screenshots from Insights with a demo cell selection.
Questions that normally take a week.
- How do cells compare in gravimetric energy and power density?
- Which cathode chemistry is used for which performance requirement?
- How does the performance of sodium-ion cells compare to lithium-ion cells?
- How do different manufacturers position their products?
- How does available energy density evolve over time?
Each one answered from measurements, with the charts already built — not as a table you have to interpret yourself.
Start from your question, not from our product names.
Seven things Batemo delivers. Which one you need depends entirely on what you are trying to find out.
Which cells should I even be looking at?
Measured behavior of every cell in the library, side by side — including what the public Explorer does not show.
Batemo Insights · you are here
How will this cell behave in my system?
A physical simulation model of the cell that runs in your own environment, under conditions you have never tested.
Batemo Cell Model
What did this cell actually do on the bench?
The full experimental characterization across the operating range, as measured — plus the viewer to read it.
Batemo Cell Data
A teardown report: materials, internal construction and safety-relevant findings, without opening a cell yourself.
Batemo Cell Report
Where inside the cell does it get hot?
A spatially resolved model of a sub-volume — local distributions the one-dimensional cell model averages out.
Batemo Cube Model
What happens if I change the cell itself?
Vary design parameters of an existing cell and see the consequence before anyone builds a sample.
Batemo Cell Designer
How does this scale to a module and a pack?
From cell to pack: cooling, mechanics and cost weighed against each other in simulation.
Batemo Pack Designer
See it against your own shortlist.
Bring the cells you are considering. A demo takes about thirty minutes and is run by an engineer, not by sales.